
ELK
- Elasticsearch + Logstash + Kibana
- Elasticsearch는 Apache의 Lucene을 바탕으로 개발한 실시간 분산 검색 엔진이며,
- Logstash는 각종 로그를 가져와 JSON형태로 만들어 Elasticsearch로 전송하고,
- Kibana는 Elasticsearch에 저장된 Data를 사용자에게 Chart 형태로 보여주는 시각화 솔루션이다.

- http://elastic.co 사이트 오픈소스 제품
장점
- Google Analytics(GA)의 데이터로 사이트 접속 통계를 구할 경우 원하는 대로 데이터를 획득하기 어렵다.
- 자체 서버의 모든 로그를 100% 수집할 수 있기 때문에 데이터에 대한 신뢰성이 높다.
- 파라미터 값별로 통계를 볼 수 있기 때문에 정확한 데이터 분석이 가능하다.
- 검색엔진(lucene)이 포함되어 있어, 빠르게 데이터를 검색할 수 있다.
- 모두 오픈소스이며 자유롭게 사용이 가능하다.
사전 준비
- 로그수집 서버(AWS 추천)
- aws 접속 key가 있는 경우
- 윈도우에서 git bash 추천(http://git-scm.com). putty 접속보다 쉬움
- 리눅스 서버 CentOS 또는 Ubuntu
- Java 1.8 이상
통합설치
- elasticsearch + kibana + logstash with openjdk1.8 + nginx
- for AWS t2.medium : minimum 4G RAM
bashcurl -L https://okdevtv.com/md/elk/elastic-setup.sh | sh
nginx 설치(샘플용)
textsudo dnf install nginx -y
sudo service nginx start
curl -i http://localhost
sudo chmod 644 /var/log/nginx
sudo chown -R ec2-user:ec2-user /usr/share/nginx/html
echo "<h1>Hello World</h1>" > /usr/share/nginx/html/hello.html
- more nginx 설치
jdk 1.8
textsudo dnf remove java-1.7.0-openjdk.x86_64 -y
sudo dnf install java-1.8.0-openjdk-devel.x86_64 -y
which javac
readfile -f `which javac`
- set JAVA_HOME in ~/.bash_profile
textexport JAVA_HOME=/usr/lib/jvm/java-1.8.0-openjdk-1.8.0.201.b09-0.43.amzn1.x86_64
- more install
system env
- check env
textulimit -a
set
textsudo vi /etc/security/limits.conf
textec2-user hard nofile 65536
ec2-user soft nofile 65536
ec2-user hard nproc 65536
ec2-user soft nproc 65536
textsudo vi /etc/rc.local
textecho 1048575 > /proc/sys/vm/max_map_count
textsudo sysctl -w fs.file-max=65536
cat /proc/sys/fs/file-max
textsudo reboot
AWS 포트 설정
- EC2 Security Groups
- 외부 접근 포트 추가(inbound)
- http(80)
설치
-
Elasticsearch
-
Kibana
-
Logstash (FluentD로 대치 가능)
-
버전을 맞춰서 작업하는 것이 좋지만, 최신 버전으로 작업해도 동작함(2016/04/03 현재)
-
Elasticsearch와 Kibana는 권장 버전을 맞춰야 함
-
설치 위치 ~/local/ 또는 /opt/ 권장
Elasticsearch 설치
textmkdir ~/local
cd ~/local
wget https://artifacts.elastic.co/downloads/elasticsearch/elasticsearch-6.8.1.tar.gz
tar xvfz elasticsearch-6.8.1.tar.gz
ln -s elasticsearch-6.8.1 elasticsearch
cd elasticsearch
bin/elasticsearch -d
# 데몬(백그라운드)로 실행. 옵션 -d를 빼면 터미널 접속해 있는 동안만 실행
- 실행 확인
textcurl -i http://localhost:9200/
Kibana 설치
textcd ~/local
wget https://artifacts.elastic.co/downloads/kibana/kibana-6.8.1-linux-x86_64.tar.gz
tar xvfz kibana-6.8.1-linux-x86_64.tar.gz
ln -s kibana-6.8.1-linux-x86_64 kibana
cd kibana
textbin/kibana
# background run
nohup bin/kibana &
curl localhost:5601
Logstash 설치
textcd ~/local
wget https://artifacts.elastic.co/downloads/logstash/logstash-6.8.1.tar.gz
tar xvfz logstash-6.8.1.tar.gz
ln -s logstash-6.8.1 logstash
cd logstash
- conf 파일 생성
textmkdir logconf
vi logconf/nginx.conf
textinput {
file {
path => "/var/log/nginx/access.log"
start_position => beginning
}
}
filter {
grok {
match => { "message" => "%{COMBINEDAPACHELOG}"}
}
geoip {
source => "clientip"
}
}
output {
elasticsearch {}
}
- logstash 실행
text# test
bin/logstash -f logconf/nginx.conf -t
# run
bin/logstash -f logconf/nginx.conf
# background run
nohup bin/logstash -f logconf/nginx.conf &
textcurl 'http://localhost:9200/_template'
curl -XDELETE 'http://localhost:9200/_template/logstash'
curl -XPUT 'localhost:9200/_template/logstash?pretty' -H 'Content-Type: application/json' -d'
{
"template" : "logstash-*",
"version" : 60001,
"settings" : {
"index.refresh_interval" : "5s"
},
"mappings" : {
"_default_" : {
"dynamic_templates" : [ {
"message_field" : {
"path_match" : "message",
"match_mapping_type" : "string",
"mapping" : {
"type" : "text",
"norms" : false
}
}
}, {
"string_fields" : {
"match" : "*",
"match_mapping_type" : "string",
"mapping" : {
"type" : "text", "norms" : false,
"fields" : {
"keyword" : { "type": "keyword", "ignore_above": 256 }
}
}
}
} ],
"properties" : {
"@timestamp": { "type": "date"},
"@version": { "type": "keyword"},
"geoip" : {
"dynamic": true,
"properties" : {
"ip": { "type": "ip" },
"location" : { "type" : "geo_point" },
"latitude" : { "type" : "half_float" },
"longitude" : { "type" : "half_float" }
}
}
}
}
}
}
'
Filebeat
- http://www.elastic.co/downloads/beats/filebeat
- Filebeat : Real-time insight into log data.
- Packetbeat : Analyze network packet data.
- Winlogbeat : Analyze Windows event logs.
- Metricbeat : Ship and analyze metrics.
- Heartbeat : Ping your Infrastructure.
- Auditbeat : Send audit data to Elasticsearch.
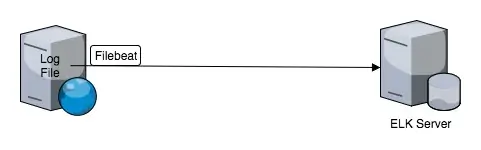
Filebeat with logstash
- (Optional)
- logstash forwarder(deprecated) 의 경량(lightweight) 버전
- logstash plugin 설치
textcd ~/local/logstash
./bin/logstash-plugin install logstash-input-beats
- filebeat 설치
- log 파일 접근을 위한 권한 필요
textcd ~/local
wget https://artifacts.elastic.co/downloads/beats/filebeat/filebeat-6.8.1-linux-x86_64.tar.gz
tar xvfz filebeat-6.8.1-linux-x86_64.tar.gz
ln -s filebeat-6.8.1-linux-x86_64 filebeat
cd filebeat
# elasticsearch 부분 #으로 주석 처리
# output.elasticsearch:
#hosts: ["localhost:9200"]
# logstash 부분 # 주석 해제
output.logstash:
hosts: ["localhost:5044"]
# filebeat.yml 내용 중 로그 위치 변경 `/var/log/nginx/*.log`
- logconf/nginx.conf 파일 변경
textinput {
beats {
port => 5044
}
}
실행
text./filebeat -e -c filebeat.yml
- start shell
textecho "nohup ./filebeat -e -c filebeat.yml &" > start.sh
chmod +x start.sh
./start.sh
Kibana 통계
시각화(Visualize)
- Terms(request.raw, clientip.raw, …) 또는 Filters(request: “/hello.html”, …) 이용해서 차트 생성
- 테이블, 라인차트, 파이차트, 지도 등 가능
- 만들어진 차트는 저장 가능
대시보드 만들기
- 저장된 차트를 한 화면에서 볼 수 있도록 추가, 레이아웃 가능
part 2
Logstash
- 필드 추가
textfield{
mutate {
add_field => {
"reqs" => "%{request}"
}
}
}
- 분리
textfield{
mutate {
split => ["reqs", "?"]
add_field => { "uri" => "%{[reqs][0]}" }
add_field => { "req_uri" => "%{[reqs][0]}" }
# add_field => { "querystring" => "%{[reqs][1]}" }
}
}
- 필드 제거
text mutate {
remove_field => [
"reqs",
"uri"
]
}
- 파라미터 필드 만들기
textfilter {
mutate {
add_field => {
"tmp" => "%{request}"
}
}
if [tmp] =~ "\?" {
mutate {
split => [
"tmp", "?"
]
add_field => {
"params" => "%{[tmp][1]}"
}
}
kv {
field_split => "&"
source => "params"
include_keys => [ "category", "utm_source" ]
prefix => "param_"
}
}
}
- 또는
text # params
if [request] =~ "\?" {
kv {
field_split => "&"
source => "querystring"
include_keys => [ "query", "redirectUrl" ]
prefix => "param_"
}
}
- 이미지 제거
textfilter {
if [message] =~ "^#|\.(css|js|ico|png|xml|jpg|JPG|gif|jpeg|eot|htc\?) " {
drop {}
}
}
- 문자열 체크
textif [agent] =~ "Mediapartners" {
drop {}
}
if [device] == "Spider" {
drop {}
}
- useragent 파싱
text useragent {
source => "agent"
}
- timestamp 조정(apache log)
text date {
match => [ "timestamp", "dd/MMM/yyyy:HH:mm:ss Z" ]
}
text urldecode {
field => "params"
}
- to integer
text mutate {
convert => [ "bytes", "integer" ]
}
- 하나 이상의 로그 포맷
textfilter {
grok {
match => [
"message", "%{COMBINEDAPACHELOG}",
"message", "%{COMMONAPACHELOG}"
]
}
}
- elsasticsearch index 설정
textoutput {
elasticsearch {
hosts => "localhost:9200"
manage_template => false
index => "%{[@metadata][beat]}-%{+YYYY.MM.dd}"
document_type => "%{[@metadata][type]}"
}
}
- replace
text mutate {
gsub => [ 'message', '\\x22', '']
gsub => [ 'message', '"@fields": {', '']
gsub => [ 'message', '} }', '}']
gsub => [ 'message', '@', '']
}
geo_point
- elasticsearch mappings
textcurl -XPUT http://localhost:9200/my_index/ -d '
{
"mappings" : {
"logs" : {
"properties" : {
"location" : { "type" : "geo_point"}
}
}
}
}'
- logstash conf
textfilter {
csv {
columns => ["lv","region_addr",
"latitude","longitude","cnt"]
}
mutate {
convert => {"longitude" => "float"}
convert => {"latitude" => "float"}
add_field => ["location", "%{longitude}"]
add_field => ["location", "%{latitude}"]
}
mutate {
convert => [ "location", "float" ]
}
}
- sample log
textlv,region_addr,latitude,longitude,cnt
1,강원,37.88532579,127.729829,7
Kibana
elasticsearch
- 데이터 지우기
curl -XDELETE http://localhost:9200/logstash*
Kibana 인증 with nginx
htpasswd 설치
textsudo dnf install httpd-tools -y
textsudo htpasswd -c /etc/nginx/htpasswd.users kibanaadmin
- 사용자 추가
textsudo htpasswd /etc/nginx/htpasswd.users kenuheo
nginx 설정 추가
textsudo vi /etc/nginx/nginx.conf
server_name:아래 kibana 프록시 설정
text auth_basic "Restricted Access";
auth_basic_user_file /etc/nginx/htpasswd.users;
location / {
sendfile off;
proxy_pass http://126.8.1.1:5601;
proxy_redirect default;
proxy_http_version 1.1;
proxy_set_header Host $host;
proxy_set_header X-Real-IP $remote_addr;
proxy_set_header X-Forwarded-For $proxy_add_x_forwarded_for;
proxy_set_header X-Forwarded-Proto $scheme;
proxy_cache_bypass $http_upgrade;
proxy_max_temp_file_size 0;
}
- nginx 재시작
sudo service nginx start
- 5601 포트는 막고 80으로만 접속
Kibana with PM2
- download from http://nodejs.org and install node.js
textnpm install -g pm2
cd ~/local/kibana
pm2 start bin/cli
- check kibana status with
pm2 list - pm2 logs path is placed in ~/.pm2/logs
참고
-
Logstash grok patterns
-
ELKR (ElasticSearch + Logstash + Kibana + Redis) 를 이용한 로그분석 환경 구축하기
-
2016 ELK 스택으로 서울시 지하철 대시보드 만들기 추천
-
EMOCON 2015 F/W ELK 스택을 사용한 서울시 지하철 대시보드 만들기
-
ELK 구축하기 1 – LOGSTASH
-
[Ubuntu] ELK 설치 및 테스트 하기
-
Splunk 대체 Solution으로서의 ELK Stack
-
How To Install Elasticsearch, Logstash, and Kibana 4 on Ubuntu 14.04
-
ELK 프로그래밍 방송 영상
-
Logstash Configuration
-
Elasticsearch(Lucene) Query Syntax
-
ELK Kibana 사용법
-
okdevtv.conf